The
Finished Goods Series ™
from E/Step Software Inc.
from E/Step Software Inc.


Fourier Seasonal Analysis (FSA) is based upon the mathematics of Joseph Fourier, a 19th century French mathematician and physicist. He demonstrated that any periodic observation can be represented by combinations of SINE and COSINE waves. These techniques are well used in engineering to model the oscillations of mechanical and electrical systems. They describe harmonics.
Likewise this same technique can be applied to the oscillation of seasonal demand. The seasonality of a product's demand is a combination of cycles during the year. FSA fits the best combination of cycles (or none) to fit a SKU's history. If there is statistically significant seasonality, then FGS will use it in the forecast.
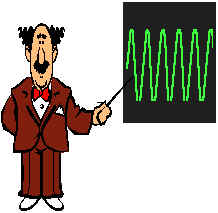 This technique is also called
spectral analysis or harmonic
smoothing. The system applies various cycles and phase shifts to the
demand history until it comes up with the most statistically significant
result. Complex models may have two cycles (two highs and two lows per
year) or even more. End of quarter pushes are often observed as four cycle models. And if you have a
big year-end push, you may see a 5 cycle model. (We call this
management-induced seasonality...but you still
have to plan for it.)
This technique is also called
spectral analysis or harmonic
smoothing. The system applies various cycles and phase shifts to the
demand history until it comes up with the most statistically significant
result. Complex models may have two cycles (two highs and two lows per
year) or even more. End of quarter pushes are often observed as four cycle models. And if you have a
big year-end push, you may see a 5 cycle model. (We call this
management-induced seasonality...but you still
have to plan for it.)
Fourier models are orthogonal models. This means they include each effect once and only once. Non-orthogonal models can include some effects multiple times and exclude others all together. This is why Fourier models almost always do better than non-orthogonal models such as the Base Index method.