from E/Step Software Inc.
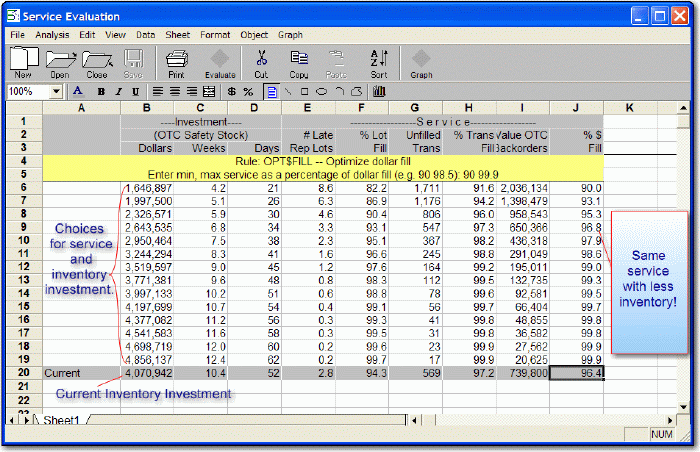
This is an example of setting service in FGS using the same four Class A service parts used in the ”Compare 3 Measures of Service” page. Currently the investment strategy uses the 10.4 week fixed-time-supply policy. For a $4.07 million dollar investment we are getting 96.4% dollar fill service.

The analyst considers using the Optimized Dollar Fill policy and wants to look at alternative investments that provide a dollar fill service between 90 and 99.9%. FGS displays 14 alternative policies whose inventory investment ranges from $1.6 million up to $4.9 million. The fourth row provides the same overall service but for a cost of just $2.6 million, a $1.4 million improvement. You can also see two other service measures: Lot Fill—the number of times the shelf goes empty (potential expedites); and Transaction Fill—typically the number of customer order line items not filled from stock (although it's also used for Unit Fill).

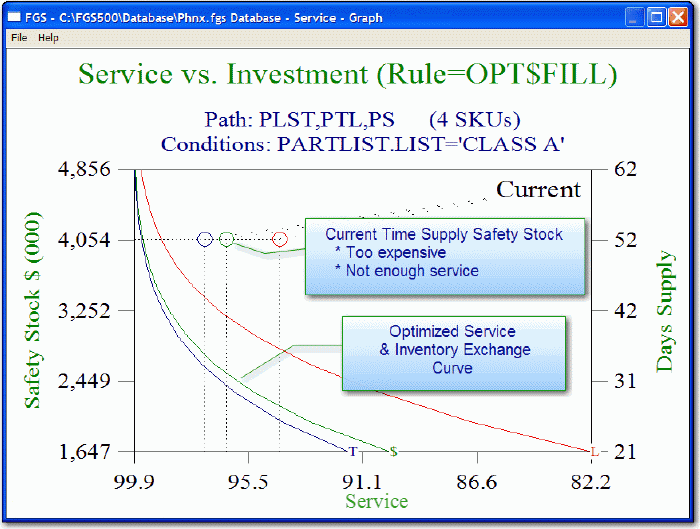
This is a graphic visualization of the prior screen—a service/inventory exchange graph of the same alternatives. This horizontal axis shows service from 99.9 to 82.2 percent (higher service to the left, lower service to the right) and the vertical axis is safety stock investment in dollars and days. There are three curves displaying the three measures of service: dollar fill, lot fill, and transaction fill, computed using the Optimized Dollar Fill rule. As investment is increased the service gets better. The circles represent the current fixed-time-supply policy. Since the analyst desires to improve the dollar fill service, the green circle can move toward the curve: