The
Finished Goods Series ™
from E/Step Software Inc.
from E/Step Software Inc.

by John A. Estep, CFPIM
Thirty years ago computers were used only by scientists and engineers. Today anyone can use one. This is largely true of forecasting tools, as well. Today’s powerful desktop computers, with superb graphics and powerful processors, can apply sophisticated statistical tools to the toughest forecasting problems. Consider the following:
System vs. User Sophistication. You don’t need a degree in mechanical engineering to drive a car with an automatic transmission, and you shouldn’t need a degree in statistics to use forecasting software. That doesn’t mean a system should be simple, but it should be simple to use. Simple systems won’t solve the tough forecasting problems manufacturers face. Sophisticated systems will, but they should insulate the forecaster from the statistical complexity.
Operating a forecasting system is an analytical task, not a clerical one. Don’t expect clerical personnel to run forecasting software. Users should know their products and their markets and should be comfortable with numbers.
Integrated Inventory Planning. This is the most critical, and most often lacking, ingredient. A forecast is not a number, but a range; for example: the forecast for July is 2,000 (most likely) plus 250 (safety stock) to achieve 98% service. Higher service requires more inventory, lower requires less.
The safety stock should be computed from service target, forecast error, error distribution, replenishment frequency, and lead time, among other things. It should not be a fixed-time-supply guess, which puts too much inventory in most items, while putting too little in a few--yielding a frustrating combination of high inventory and low service. You should be able to specify the service target and compute the inventory required for each item, or specify the inventory and compute the service it delivers.
Up-to-Date Modeling Logic. Forecast models should account for the level (rate of demand per period), trend (rate of increase or decrease) and seasonality (periodic fluctuations around the trend line). Avoid systems without trend models (e.g., moving averages).
Seasonality poses the greatest problems. Obsolete seasonal models often lack orthogonality, meaning that some effects are overlooked while others are counted twice, producing wildly fluctuating and inappropriate forecasts. Base (or seasonal) indices, for example, confuse trend and seasonal effects (e.g., failing to detect a seasonal decline in a rising market), and cannot use partial years of history. Instead, look for systems using Fourier models, which also excel at handling items with low demand.
Selectable Forecast Calendars. With fast computers you don’t have to treat all items alike; instead treat each item appropriately. Fast-moving products are more accurately forecasted using weekly or biweekly calendars. Slow-moving products do better on calendars ranging from bimonthly to annual. Forecast monthly only items which need to be forecasted monthly. This also saves work. Avoid systems which require you to put different calendars in separate databases.
Accurate Selling Day Adjustment. While many systems understand February has fewer selling days than August, you want one which also recognizes January may have more selling days this year than next. A system does this if you are asked to enter the selling or non-selling days for past and future years. Otherwise the system is applying a single set of factors to all years. Look for the ability to define your own calendars.
Measuring Errors. New users worry about percentage error, losing sleep over a 40% error which is covered by $10 of safety stock, yet satisfied with a 10% error that requires $100,000. To manage forecast error, you need to know the dollar value of the inventory required to achieve your service objectives. Charting this number documents error reductions and alerts you to problems.
Internally, errors are computed using either a standard deviation or a mean absolute deviation (MAD). The standard deviation is the proper statistical measure. The MAD was devised in the 1950s because it doesn’t require square roots in its computation, and early computers took a long time on square roots. Even MAD’s inventor has declared it obsolete, but it still appears in some packages.
Separate Forecast Initialization and Revision Processes. Forecast initialization, or model-fitting, is the process of discovering the most appropriate model for each item. The revision process tweaks these models to reflect recent experience.
Why not fit new models every period? Most companies’ products exhibit fundamental stability most of the time. If a forecast model accurately represents the underlying demand it will be effective for some time. There are changes, but usually in degree, not in kind.
The forecast revision process serves two purposes: to make changes in degree, which keep the model current, and to identify items where the model no longer appears appropriate. This lets you concentrate on the 10% (typically) of items for which the market appears to have changed. You can ignore the other 90%. You want to spend time solving problems, not looking for them. Look for statistical process control (SPC) techniques to direct your attention and prioritize exceptions so you review the most important items first.
Watch out for focus type (or other) systems which lack a separate revision process. A revision process typically reduces forecast errors and inventory about 30% in the year or two following the model fit.
Evaluated Marketing Intelligence. Most systems allow overrides to the forecast, but not all evaluate how much it helped or hurt. Marketing intelligence feedback reduces inventory to cover forecast errors and saves time by eliminating a common tendency to over control.
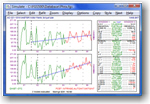
Graphical Tools. Most people grasp relationships better from pictures than from tables of numbers. Look for graphic comparisons of forecast alternatives and error tracking, as well as graphic displays of service/inventory tradeoff and error distribution.
Multi-Level Summarization. Some users need forecasting at plant, warehouse, etc., levels. All users need flexible ad hoc summaries. You don’t want to restructure your entire database just to summarize at a new level.
Flexibility. Look for a system which can easily grow with you, because your needs will change. Flexibility is the key to growth. Look for a user modifiable and extendable database, not one that already has all the fields you think you need. You should be able to add or modify fields any time, and use them in reports, summaries, interfaces, calculations, and screens. Interfaces also should be modifiable by you at any time. Macros are essential, allowing you to automate your processes, and eliminate keying errors.
Check the run-time options available in the standard reports. Record selection, calendar, horizon, break fields, weight fields, scale factor, print formats, and destination (printer, file, screen) are most useful. While a wide variety of standard reports is important, a report writer is imperative. How can someone who doesn’t know your business decide what you need?
Flexibility shouldn’t require modifying the source code. When you touch the source code, your system becomes an orphan. You cannot upgrade to a new release without redoing all your changes, eliminating product improvements. If offered the source code, ask what essential flexibilities are missing.
While the above list is not all inclusive, it does cover the features most important for your success. Some of these are under the surface, so ask questions if a topic isn’t mentioned in the brochure, and watch out for obsolete technology hiding behind a new graphical user interface.
John A. Estep is president of E/Step Software Inc.,, a Yakima, Washington based company specializing in systems for finished goods/service parts forecasting and inventory planning. With a background in mathematics, operations research, and computer engineering, he worked on his first forecasting system for Talon Zipper Company in 1970 and has counseled hundreds of companies on their forecasting needs.